STAT7055
# week 1
# 怎样用统计学获得数据支持
- Established a research question, or hypothesis, that can be tested.
- Determined some relevant variables.
- Identified our population of interest.
- Gathered some data by taking a sample from the population.
- Analysed our data and the relevant variables.
- Formed an inference or conclusion regarding the original hypothesis
# Concepts
population mean $\mu$ population variation $\sigma^2$
sample mean $\bar{X}$ sample variation $s^2$
# 数据的分类
- Categorical Data
- Nomial, 各种无关联形容词
- Ordinal, poor/fair/good
- Numeric
- 离散
- 连续
# Descriptive tools for Categorical Data
mode, frequency, bar chart, pie chart
ordinal 只是多一个 order
# Descriptive tools for Numeric Data
- Mean, median, mode.
- Quantiles.
- Range, interquartile range, variance, coefficient of variation.
- Covariance, correlation.
- Histograms.
- Boxplots.
- central trendency
# relative standing
measure 某个数据在总体的位置, 比如 quatiles, 31st percentile
# percentile
$L_p = (n+1)\frac{p}{100}$
数据有8个(n=8), 那么 31st percentil($L_{31}$) 在
$L_{31} = (8+1)\frac{31}{100} = 2.79$
# interquartile range (IQR)
$IQR = Q_3 - Q_1$
# Variance
population variance $\sigma^2$
$\sigma^2 = \frac{1}{N} \sum^N_{i=1}(X_i - \mu)^2$
sample variance $s^2$
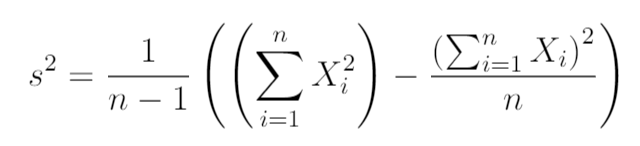
$s^2 = \frac{1}{n-1} \sum^N_{i=1}(X_i - \bar{X})^2$
shortcut
为什么样本方差(sample variance)的分母是 n-1?_样本方差的分母为什么是n-1_羊老羊的博客-CSDN博客
# Standard deviation
= Variance 开方
population sd $\sigma$
sample sd $s$
# * Coefficient of Variation
用来比较两组(很可能是规格不同的)数据的分散情况的标化指标, cv越大, 表示越分散
population $CV=\frac{\sigma}{\mu}$
sample $cv=\frac{s}{\bar{X}}$
# covariance
协方差是两个变量之间线性关系的度量,描述它们如何相互关联
population covariance $\sigma_{XY} = \frac{1}{N}\sum^N_{i=1}(X_i-\mu_X)(Y_i-\mu_Y)$
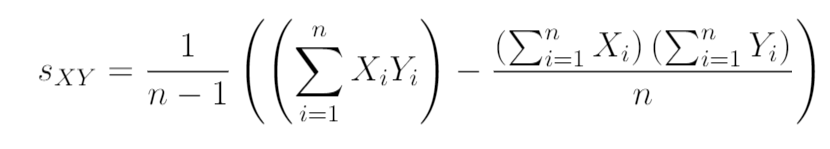
sample covariance $s{XY} = \frac{1}{n-1}\sum^N_{i=1}(X_i-\bar{X})(Y_i-\bar{Y})$
shortcut
# * Correlation Coefficient
数据相关性的标化指标, 比如有 A,B 两组数据, 想知道 A与C 更相关, 还是 B与C更相关, 就可以用这个指标
值的范围是-1.0至1.0. 越接近1.0表示越强的正相关, 越接近 -1.0表示越强的负相关
population cor $\rho_{XY} = \frac{\sigma_{XY}}{\sigma_{X}\sigma_Y}$
sample cor $r_{XY} = \frac{s_{XY}}{s_{X}s_Y}$
# P47的例题数据 用R计算
|
|