Search

Search IconIcon to open search

python 数据可视化统览

Last updated Feb 7, 2024

可视化核心库:

使用:

# 数据集的载入

  • seaborn.load_dataset(“iris”)
  • sklearn.datasets.load_iris()
  • plotly.express.data.iris()

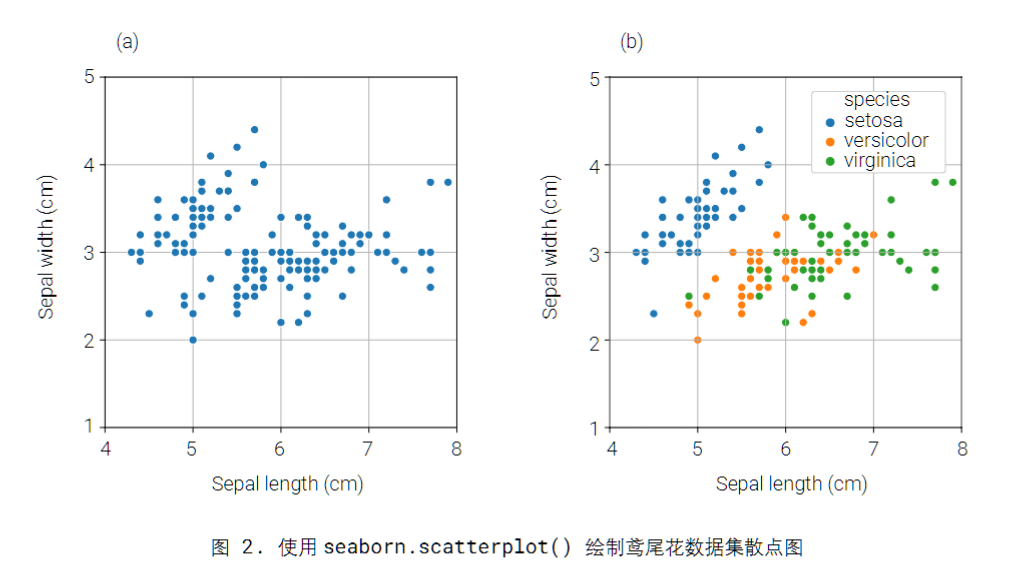
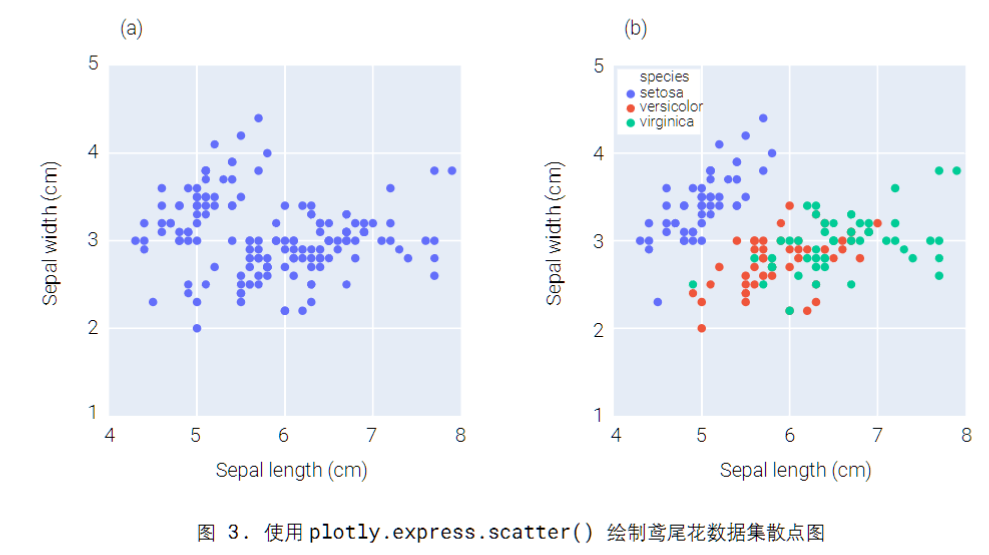
# 散点图

推荐 seaborn

 1
 2
 3
 4
 5
 6
 7
 8
 9
10
11
12
13
14
15
16
17
import matplotlib.pyplot as plt
import numpy as np
import plotly.graph_objects as go

x1_array = np.linspace(-3, 3, 100)
x2_array = np.linspace(-3, 3, 100)

xx1, xx2 = np.meshgrid(x1_array, x2_array)
ff = xx1 * np.exp(- xx1**2 - xx2**2)

levels = dict(start=-0.5, end=0.5, size = 0.05)
data = go.Contour(x=x1_array, y=x2_array, z=ff, 
                contours_coloring='lines', line_width=2
                colorscale = 'RdYlBu_r',
                contours=levels)
fig = go.Figure(data=data)
fig.show()

  • 还可以用 plotly.express.scatter() 和 plotly.graph_objects.Scatter()
  • matplotlib.scatter()

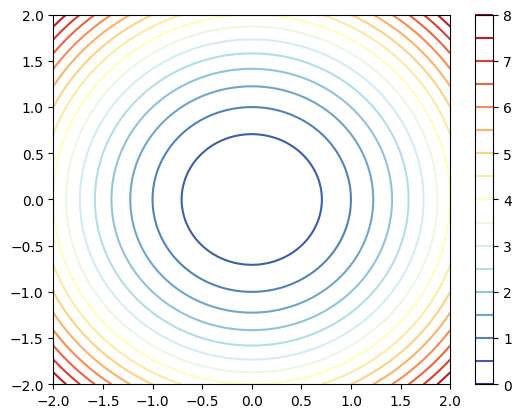
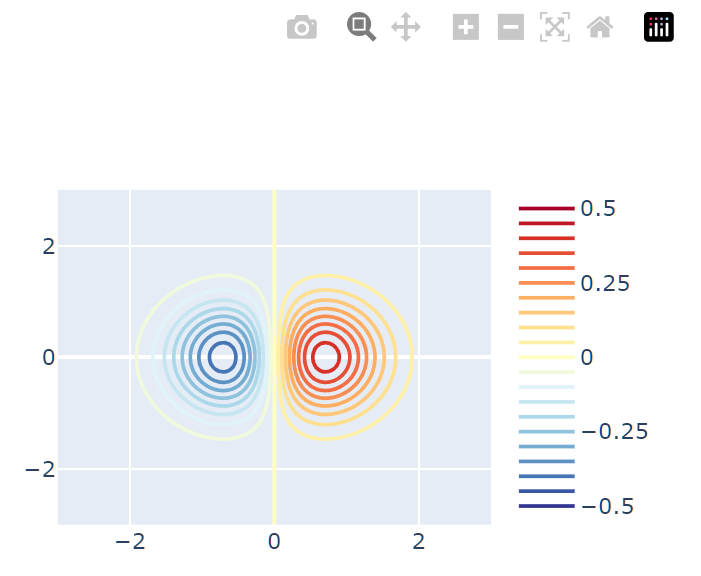
# 等高线图 contour

  • plt.contour()
  • px.Contour()
1
2
3
4
5
6
import matplotlib.pyplot as plt
import numpy as np

x = np.linspace(-2, 2, 100)
y = np.linspace(-2, 2, 100)
X, Y = np.meshgrid(x, y)

 1
 2
 3
 4
 5
 6
 7
 8
 9
10
11
12
13
14
import matplotlib.pyplot as plt
import numpy as np
import plotly.graph_objects as go

x1_array = np.linspace(-3, 3, 100)
x2_array = np.linspace(-3, 3, 100)

xx1, xx2 = np.meshgrid(x1_array, x2_array)
ff = xx1 * np.exp(- xx1**2 - xx2**2)

levels = dict(start=-0.5, end=0.5, size = 0.05)
data = go.Contour(x=x1_array, y=x2_array, z=ff,contours_coloring='lines', line_width=2, colorscale = 'RdYlBu_r', contours=levels)
fig = go.Figure(data=data)
fig.show()